
2DE Analysis of
intact Proteins
Our analysis of intact proteins is based on high-performance two-dimensional gel electrophoresis (2DE). In contrast to (peptide based)
LC-MS analysis, our high performing 2DE analyzes intact proteins which may include all information about
- • protein isoforms
- • splicing variants
- • post translational modifications such as
phosphorylation, glycosylation or oxidation - • pI
- • molecular weight
Depending on the experiment and the status of the samples (e.g. sample amount, protein concentration, required buffer) we provide a large choice of different methods. We hereby combine our powerful fluorescent labeling technologies with more than 10 years of hands-on experience.
.
2DE Applications (selection)
- • Characterisation of a single proteome (protein pattern, PTM and isoform distribution): T-Rex 2D
- • Proteome profiling (differentiall analysis of two or more proteomes): (Refraction-2D, Saturn-2D)
- • Redox state analysis: Saturn-2D REDOX
- • Analysis of post-translational modifications (e.g. Phosphoryltion and Glycosylation): T-Rex 2D-PHOS and T-Rex 2D-GLYCO
- • 2D Western Blot Analysis: T-Rex 2D WB
- • Host Cell Protein Analysis: T-Rex 2D HCP
.
.
.
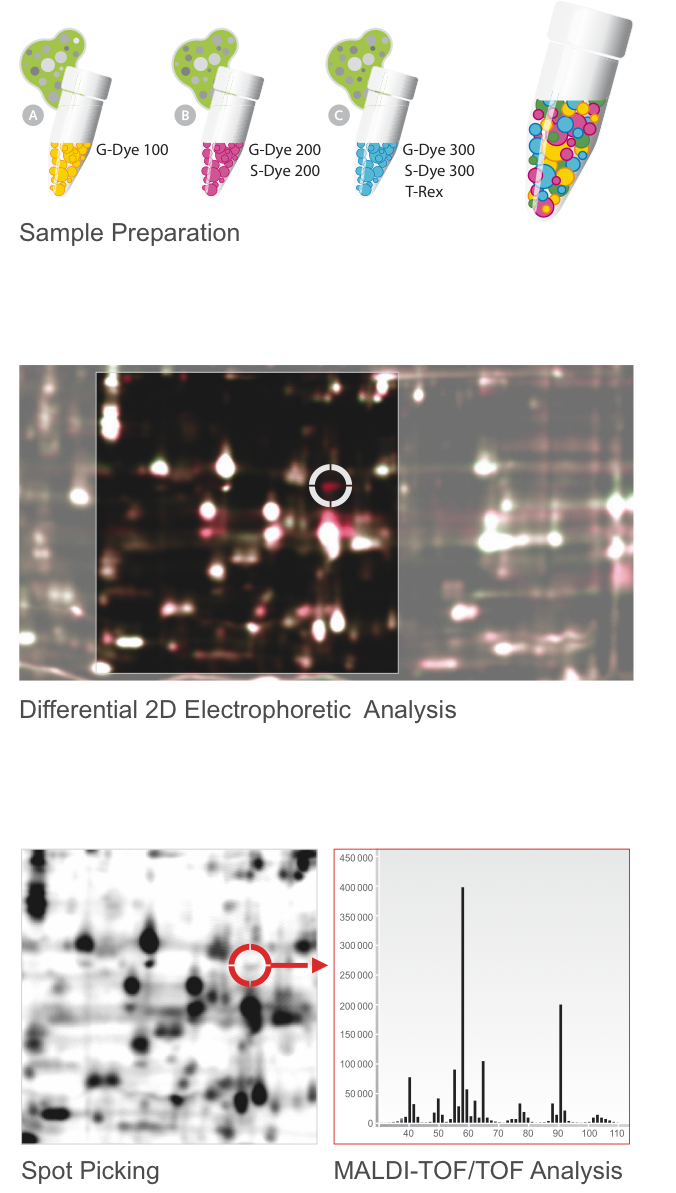
Refraction-2D (DIGE)
Commonly known as 2D Differential Gel Electrophoresis (2D DIGE) our Refraction-2D Technology is based on the pre-labeling of protein with a set of high-performing fluorescent protein labels (G-Dyes). Due to an internal standard, which includes all proteins of the whole experiment, the Refraction-2D analysis provide a very precise identification and quantification of differentially expressed or modified proteins.
.
Saturn-2D
When it comes to scarce samples Saturn-2D is the leading technology for powerful 2DE. In addition, this technology is the ideal choice when protein samples contain e.g. lots of salts and required dialysis or re-buffering would lead in too much loss of protein.
.
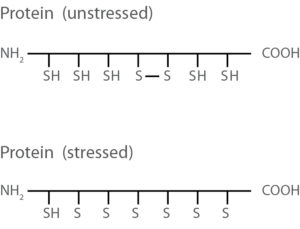
Saturn-2D REDOX
Our Saturn-2D REDOX technology perfectly illustrates changes within the complex redox interaction network. Due to specially designed Cys-interacting compounds (CinC) differences in the redox status can be easily displayed, leading to dramatic time savings for further mass spec analysis.
.
T-Rex 2D-Phos/ 2D-Glyc/ 2D-WB/ HCP
Phosphorylation Status Analysis
The combination of T-Rex label and phosphostains provide for powerful tool for the identification of differentially regulated phosphoproteins. The T-Rex labeled sample provides an reliable internal standard (with no specs or gel suffering due to additional staining/ destaining) thereby offering reliable phophorylation studies.
Glycosylation Status Analysis
The combination of T-Rex label and glycosylationstains provide for powerful tool for the identification of differentially regulated glycoproteins. The T-Rex labeled sample provides an reliable internal standard (with no specs or gel suffering due to additional staining/ destaining) thereby offering reliable phophorylation studies.
2D Western Blotting
T-Rex labeled proteins can be perfectly transfered to a blotting membrane (0.22 or 0.45 µm, NC or PVDF). The transfered protein is than detectable by rapid fluorescence imaging during all steps of the Western Blot analysis (e.g. after the transfer, after the target detection). To detect the target we recommend HRP-secondaries + for chemiluminescence or Immuno Blue Fluorescent Substrate or fluorescent secondaries. T-Rex labeled proteins do not interfere with antibody recognition and mass spectrometry.
Host Cell Protein (HCP) Analysis
The combination of 2D Western Blots and fluorescence protein labels is the most powerful method for the analysis of host cell proteins (HCP). All cell proteins are pre-labeled with the T-Rex fluorescent label, seperated by 2D electrophoresis and then transfered to a Western Blot membrane.The following Western Blot analysis and fluorescence/ chemiluminescence detection allows to presicely discriminate the overexpressed proteins from the host cell proteins by anti-HCP antibodies.The HCP coverage analysis is then automatically performed by a quick software overlay.
.
.
Further information/ price details
For further information about protein services and detailed price information, please get in touch with our service team:
Mo - Fr 9am - 5pm
+ 49 (0) 345 2799 6413
service dyeagnostics.com
.
.

Unsere Produkte
Sample labeling
1D Fluorescence Labeling Kits for
Normalisation of Western Blots
SPL Smart Protein Layers
.
Fluorescent Standards
MW Protein Standard (Cal A)
Smartalyzer S + L
.
1D Fluorescence Labeling Kits
for Protein Gel Analysis
.
2D Fluorescence Labeling Kits
Refraction-2D
Electrophoresis
Fluorescent MW Protein Standards
.
Precast Gels
VELUM 1D SDS
VELUM 1D Native
.
Elektrophoresis
ORCA Gel Electrophoresis research
ORCA Gel Electrophoresis routine
Additional Electrodes for Bi-directional Runs
Gel Frames
Western Blotting
Blotter
BEO Dry Blotter
Separation sheets
Transfer Membranes
Low fluorescent Nitrocellulose Membranes
Low fluorescent PVDF Membranes
Development folders
Immuo-Detection
Imaging Systems
Imager
ORCA Fluorescence Imager
ORCA Gel Analyzer
.
Imaging Accessories
Imaging Tray customized
.
Integrated solutions
EPO Doping Analysis
complete systems
ORCA EPO Analyzer
.
Proteingels for EPO screening
High thruput SARCOSYL-PAGE: VELUM Precast SAR Gels
.
High thruput IEF: VELUM Precast IEF Gels
.
High thruput SDS-PAGE: VELUM Precast SDS Gels
.
Fluorescent EPO Standards
SEPO
.
Blotting and Blot-Processing
High thruput Blotting Kit
.
High thruput Washing Tray for BlotCycler
Two-dimensional gel electrophoresis
The principle of 2DE
The two-dimensional gel electrophoresis (2-D electrophoresis, 2-DE) is the most powerful method to separate complex protein mixtures.
It is based on the separation of intact proteins (not peptides) according to two molecular properties: the electric charge and the size of a protein.
The 2-D electrophoresis starts with the first-dimension separation - proteins are separated according to their electric charge, that is their isoelectric point. This step is called isoelectric focusing (IEF).
The IEF is (now a days) performed on a IEF strip, an acrylamide strip containing a pH gradient. When an electric potential is given to the IEF strip, the proteins will move along the strip to that point where their electric charge is 0 (neutral charge). After the IEF, the IEF strip now holds “a line of” the separated proteins according to their electrical charge.
After a step of equilibration the IEF strip is then applied to a SDS-PAGE gel in order to run the second dimension. This separation step now separates the now denatured proteins by their molecular weight.
.
2DE separation capacity
The protein separation capacity is given by
- a) the capacity of protein load of the IEF strip
- b) the separation area of the second dimension (the size of the SDS-PAGE gel).
For protein extracts from E. coli one should separate about 500 different proteins (e.g. detected by T-Rex fluorescent protein label) with 7 cm IEF strips and mini gel size SDS-PAGE (8 x 10 cm) and about 1200 (e.g. detected by T-Rex fluorescent protein label) proteins when using 24 cm strips and maxi size SDS-PAGE (27 x 22 cm).
.
Protein detection/ visualization
The number of proteins which can be detected is dependent on the method of protein visualization.
The general sensitivity limit is...
- • for Coomassie stains: a protein with an abundance of in the range of 100-10 ng can be detected.
- • for silver nitrate stains: a protein with an abundance of about 10-1 ng can be detected.
- • for fluorescence protein labels (minimal lysine labeling): proteins with an abundance of about 1 – 0.1 ng can be detected*.
- • for fluorescence protein labels (saturation cysteine labeling): proteins with an abundance of about 0.1 – 0.01 ng can be detected*.
* adequate fluorescence detection imaging device required
.
Differential Gel Electrophoresis/ Sample multiplexing
The usage of fluorescent protein labels is a strong benefit of 2D gel electrophoresis as the detection limit and dynamic range of the signal is much better and the analysis does not suffer from protein staining artifacts like background issues, difference in results due to room temperature, freshness of stains, etc… .
However, as proteins carrying a covalently bound fluorescence tag (label), they can be specifically detected. This allows to combine many samples to one 2DE analysis to allow for a precise quantification of protein expression and/or the accurate detection of post-translational protein modifications and to dramatically reduce the number of required 2D gels.
.
Post-translational modifications
| Post-translational modification | Phosphorylation | Glycosylation | RedOx |
| PTM causes
differences in... |
pI (isoelectric point) |
molecular weight and or pI
|
molecular weight and or pI
|
| Detection by... |
|
|
|
| PTM for e.g. |
activation/ deactivation of kinases signal transduction of tumors, signal transduction upon pathogen reception
|
metabolism of tumors
important role in Alzheimers desease, diabetis, ateriosclerosis
|
activation/ deactivation of proteins tumor metabolism apoptosis ROS
|
| PubMed Publications 2016 | 13,716 | 2,300 | 1,149 |
| Pubmed Publications until May 2017 | 6,834 | 1,150 | 543 |
.
Service overview
- • proteomstudies (shot gun)
- • proteomstudies 2DE-based
- • label and label-free quantification of proteins
- • protein characterization (quantification, purity, modification, identification)
- • mutagenisis discovery
- • mircoarray follow-up
- • drug target discovery
- • assay development
- • protein pattern analysis
- • toxicological fingerprinting
- • crop testing
- • consulting for complex protein anaylsis
- • differential protein expression analysis (2D-DIGE)
- • post translational protein modifications (phosphorylation, glycosylation, RedOX)
- • biomarker discovery
- • 2D Western blotting
- • HCP coverage 2D Western blotting
- • standardized and quantitative SDS- and SAR-PAGE, IEF and Western Blots of up to 52 samples per run
.
Equipment for Gel-based Protein Analysis
- • OCRA Gel Electrophoresis Units
- • Dolphin Gel Electrophoresis Units
- • HOEFER SE900 Gel Electrophoresis
- • HOEFER Gel Electrophoresis small
- • BEO Dry Blotter
- • VELUM Dry Blotter
- • OCTOPLUS QPLEX Fluorescence Imager
- • Typhoon FLA 9000 Imager
- • HOEFER IEF
- • LabImage L360 Software
- • Delta2D Software
- • Spot Picker
- • Spot Processing
- • Fluorescent Label
- • VIS and Fluorescent Stains
.
Equipment & Technologies for Mass Spectrometry
- • Synapt High Definition MS-Systeme (HD-MS, Waters)
- • Q Exactive Plus Hybrid Quadrupole-Orbitrap MS (Thermo)
- • Xevod TQD Tandem Quadrupol MS-System (Waters)
- • MALDI-TOF/TOF (ultraflex, Bruker Daltonics)
- • MS/MS and HD-MSE
- • ESI, nano-ESI, MALDI
- • SRM, PRM und MRM
- • UPLC, nano-UPLC
- • supporting bioinformatic tools