
Refraction-2D™ Labeling Kits
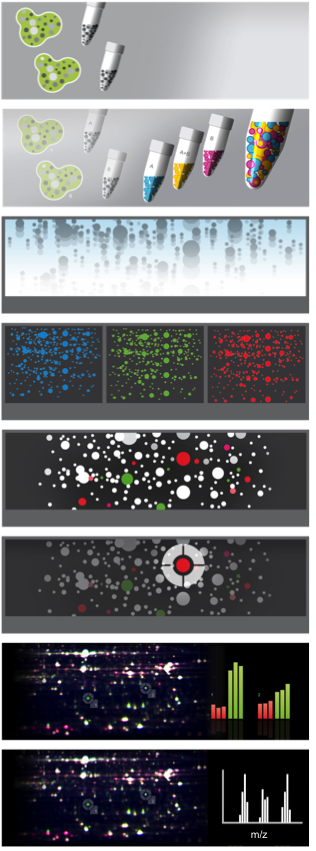
Refraction-2D™ is the leading technology for multiplex-fluorescence 2D gel electrophoresis (also known as differential gel electrophoresis; 2D DIGE). It is based on irreversible binding of high-performance fluorescent G-Dyes (blue G-Dye100, green G-Dye200, red G-Dye300 and infrared G-Dye400) to lysine in proteins.
The G-Dyes are outstandingly photostable and can be re-imaged over periods of months. Thanks to a special low molecular weight G-Dye, minimally labeled proteins can be picked directly from the 2D gel – no further staining or destaining procedures are required.
Labeling your samples with Refraction-2D™ allows you to...
- • run up to 4 different samples within one 2D gel
- • detect proteins with abundance as low as 0.03 ng
- • discover even minor but important protein regulation
- • identify post translational protein modifications
- • pick spots directly from the gel, no post-staining required
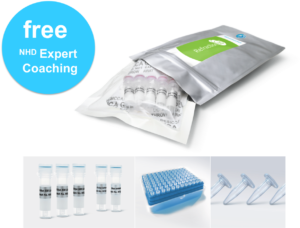
- • expert support by our 2D coaches
.
We offer state-of-the-art 2D software Delta2D for the analysis of Refraction-2D™-labeled proteins. It provides sophisticated and quick image processing and analysis. Other 2D software are also compatible with Refraction-2D labeling e.g., SameSpots (Nonlinear Dynamics), DeCyder (GE Healthcare), PD Quest (Biorad).
Rapid and sensitive G-Dye image acquisition can be performed with the Octoplus QPLEX (RGB-IR, ECL).
Our labeling kits are ready to use and are available in two variants:
- • Refraction-2D labeling for RGB-fluorescence
with G-Dye100, G-Dye200 and G-Dye300 - • Refraction-2D QPLEX for RGB-IR fluorescence
with G-Dye100, G-Dye200, G-Dye300 and G-Dye400 .
Refraction-2D™: 100% Made in Germany
.
Refraction-2D™ Labeling Kits
| Prod. No. | Description | Kit size | Price |
| PR08 | Refraction-2D
Labeling Kit |
4G
(1x 1.8 nmol) |
quote |
| PR08G | Refraction-2D
Labeling Kit |
2x 4G
(2x 1.8 nmol) |
quote |
| PR09 | Refraction-2D
Labeling Kit |
12 G
(1 x 5 nmol) |
quote |
| PR60 | Refraction-2D
QPLEX Labeling Kit |
4G
(1x 1.8 nmol) |
quote |
| PR61 | Refraction-2D
QPLEX Labeling Kit |
2x 4G
(2x 1.8 nmol)
|
quote |
| PR62 | Refraction-2D
QPLEX Labeling Kit |
12G
(1x 5 nmol)
|
quote |
.
.
.
Refraction-2D™ Kit Content
- • G-Dye100 - high performance fluorescent dye
- • G-Dye200 - high performance fluorescent dye
- • G-Dye300 - high performance fluorescent dye
- • G-Dye400 - high performance fluorescent dye (for QPLEX kits only)
- • G-Dye solvent
- • G-Dye labeling stop solution
- • G-Dye low retention tips
- • G-Dye low retention micro centrifuge tubes
- • G-Dye100 spot picking kit (free for PR09, PR10, PR11, PR12,PR13)
- • Expert support by our 2D Coaches
.
.
.
Refraction-2D™ Kit Quality Assurance
To ensure you a constant quality for your assays all G-Dyes and related Refraction-2D™ kits are subject to stringent quality control. Every batch is checked for sensitivity and labeling efficiency and only kits that succeeded our testing will therefore be delivered to you. All batches are checked periodically in a biweekly fashion throughout the shelf live mentioned on the bag label.
.
.

.
Refraction-2D™ Publications
Zadražnik T, Hollung K, Egge-Jacobsen W, Meglič V, Šuštar-Vozlič J: Differential proteomic analysis of drought stress response in leaves of common bean (Phaseolus vulgaris L.). Journal of Proteomics 2013; 78: 254-272.
Fonseca C, Planchon S, Serra T, Chandler S, Saibo N, Renaut J, Oliveira MM, Batista R (2012): Selection of the best comparator for the risk assessment of GM plants - conventional counterparts vs. negative segregant. Poster presentation
Gemoll T, Laubert T, Grimme C, Roblick UJ, Habermann JK. Hochauflösende 2D-Gelelektrophorese von Knochengewebsproben. Biospektrum 2012; 18 (5): 520-521.
More publications and selected customers you will find here.
.
Related documents
Manuals
PDF Refraction-2D™ Product Guide
.
PDF Refraction-2D™ QPLEX Product Guide
..
PDF Refraction-2D™ Spot Picking Guide
.
Safety data sheet
PDF Refraction-2D™ Safety data sheet.
.
Brochures
PDF Refraction-2D™ QPLEX brochure (twopager)
PDF Productline 2DE
.
PDF Imaging of 2D gels (Tips and tricks by DECODON)
.
.
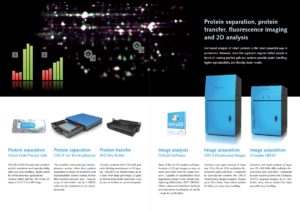
Related Products
.
2D Image acquisition (RGB)
2D Image acqusition (RGB-IR)
Precast 2D Gels
2D Gel Blotting
2D Software
.
Support
We are happy to provide further information.
Please get in touch with us by phone +49 - 345 -2799 6413 (Mo - Fri 9am - 5pm)
or by email info dyeagnostics.com.
.
