Refraction-2D™

Refraction-2D™ Labeling Kits

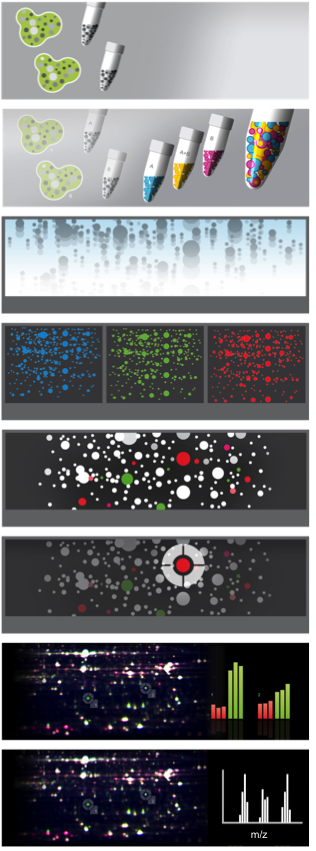
Refraction-2D™ ist die führende Technologie für die Multiplex-Fluoreszenz 2D-Gelelektrophorese (auch als Differential Gel Electrophoresis, 2D DIGE bekannt).

Labeling mit Refraction-2D™ erfolgt über die kovalente Bindung von stark fluoreszierenden G-Dyes (blau: G-Dye100, grün: G-Dye200, rot: G-Dye300 und infrarot: G-Dye400) an Lysin, der abundantesten Aminosäure in Proteinen. Durch besondere chromophore Gruppen der G-Dyes wird eine höhere Quanteneffizienz im Vergleich zu Cyaninen erreicht. Damit können auch niedrig abundante differentiell regulierte/modifizierte Proteine direkt und sicher in einem 2D Gel detektiert werden.

Refraction-2D™ bietet Ihnen ...

  • •  bis zu 4 Proben in einem 2D Gel laufen zu lassen
  • •  Proteine bis zu 0.03 ng zu detektieren
  • •  zuverlässig auch geringe Proteinregulationen zu manifestieren
  • •  Post-translationale Modifikationen sicher zu identifizieren
  • •  direkt Spots aus den Gelen zu picken - ohne Anfärben
  • •  Experten-Support durch unsere 2D Coaches

.

Die Labeling Kits sind ready-to-use und erhältlich als

  1. •  3-Farben Kit Refraction-2D™ für RGB-Multiplexing
    (G-Dye100, G-Dye200, G-Dye300).
  2. •  4-Farben Kit Refraction-2D™ QPLEX für RGB-IR-Multiplexing
    (G-Dye100, G-Dye200, G-Dye300, G-Dye400).


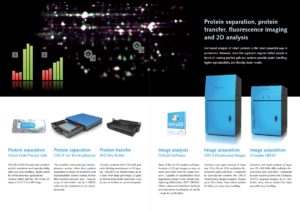
Für die Aufnahmen von 2D-Gelen (und 2D-Western Blots) mit einer Größe bis 30x 25 cm haben wir ein robustes Hochleistungssystem entwickelt.  

Der  Octoplus QPLEX (RGB-IR + ECL) kann in seiner Leistungsfähigkeit mit modernsten Fluoreszenz-Scannern konkurrieren.  Zudem ist der Octoplus QPLEX bis zu 10x schneller, ist hochempfindlich für Chemilumineszenz-Detektion (z.B. 2D-Western Blots) und nicht kaputt zu kriegen.

Für die Auswertung von Refraction-2D Gelen haben wir für Sie die modernste 2D Software nämlich  Delta2D im Portfolio.


Refraction-2D™: 100% Made in Germany

.

Refraction-2D™ Labeling Kits


Prod. Nr. Bezeichnung Kitgröße Preis
PR08 Refraction-2D

Labeling Kit

4G

(1x 1.8 nmol)


Angebot

PR08G Refraction-2D

Labeling Kit

2x 4G

(2x 1.8 nmol)

Angebot
PR09 Refraction-2D

Labeling Kit

12 G

(1 x 5 nmol)

Angebot
PR60 Refraction-2D

QPLEX 

Labeling Kit

4G

(1x 1.8 nmol)

Angebot
PR61 Refraction-2D

QPLEX 

Labeling Kit

2x 4G

(2x 1.8 nmol)


Angebot
 PR62 Refraction-2D

QPLEX 

Labeling Kit

12G

(1x 5 nmol)


Angebot

.

.

Image Refraction-2D Labeling Kit for 2D-DIGE analysis of up to 4 protein samples within one analysis.


.

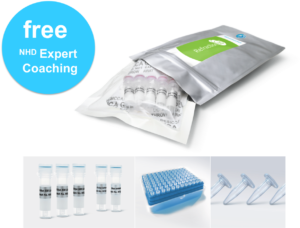
Refraction-2D™ Kit-Inhalt

  • • G-Dye100 - Hochleistungsfarbstoff
  • • G-Dye200 - Hochleistungsfarbstoff
  • • G-Dye300 - Hochleistungsfarbstoff
  • • G-Dye400 - Hochleistungsfarbstoff (nur bei QPLEX Kits)
  • • G-Dye Lösungsmittel
  • • G-Dye Stop-Lösung
  • • G-Dye Low Retention Pipetten-Spitzen
  • • G-Dye Low Retention Reaktionsgefäße
  • • G-Dye100 Spot Picking Kit (kostenlos ab Kitgröße 12G)
  • • Expert Support durch unsere 2D Coaches

.

.

Image Refraction-2D Labeling Kit for 2D-DIGE analysis of up to 4 protein samples within one analysis.

.

Refraction-2D™: Geprüfte Qualität

Um Ihnen eine gleichbleibende Qualität Ihrer Analysen zu sichern, unterliegen alle G-Dyes und die dazugehörigen Refraction-2D™ Protein Labeling Kits strengsten Qualitätskontrollen. Jedes Batch wird auf Sensitivität und Labeling-Effizienz hin überprüft und nur erfolgreich getestete Kits verlassen unser Haus. Alle Batches werden bis zum Ablauf des von uns empfohlenen Verwendungsdatums 2-wöchentlich überwacht.

.

.

Refraction-2D™ Labeling Kit - Quality Label

.

Refraction-2D™ Publikationen

Herzog R, Wagner A, Wrettos G et al. Improved Alignment and Quantification of Protein Signals in Two-Dimensional Western Blotting. Journal of Proteome Research 2020;19(6):2379-2390. DOI: 10.1021/acs.jproteome.0c00061

Hecht-Höger AM, Braun BC, Krause E et al. Plasma proteomic profiles differ between European and North American myotid bats colonized by Pseudogymnoascus destructans. Mol Ecol. 2020;29(9):1745‐1755. doi:10.1111/mec.15437

Gemoll T, Rozanova S, Röder C et al. Protein Profiling of Serum Extracellular Vesicles Reveals Qualitative and Quantitative Differences After Differential Ultracentrifugation and ExoQuickTM Isolation. J Clin Med. 2020;9(5):E1429. Published 2020 May 12. doi:10.3390/jcm9051429

Boehm M, Herzog R, Klinglmüller F et al. The Peritoneal Surface Proteome in a Model of Chronic Peritoneal Dialysis Reveals Mechanisms of Membrane Damage and Preservation. Front Physiol. 2019; 10: 472.


Fragkostefanakis S, Simm S, El‐Shershaby A et al. The repressor and co‐activator HsfB1 regulates the major heat stress transcription factors in tomato. Plant Cell Environ. 2019; 42: 874890. https://doi.org/10.1111/pce.13434


Hecht-Höger A (2019). Development and application of novel immunological approaches to chiropteran immunology. Dissertation.


Lennicke C, Rahn J, Bukur J et al. Modulation of MHC class I surface expression in B16F10 melanoma cells by methylseleninic acid. Oncoimmuncology. 2017; 6(6): e1259049.

Lennicke C, Rahn J, Kipp AP et al. Individual effects of different selenocompounds on the hepatic proteome and energy metabolism of mice. Biochim Biophys Acta Gen Subj. 2017;1861(1 Pt A):3323-3334. doi:10.1016/j.bbagen.2016.08.015

Batista R, Fonseca C, Planchon S et al. Environmental stress is the major cause of transcriptomic and proteomic changes in GM and non-GM plants. Sci Rep. 2017;7(1):10624.

Strohkamp S, Gemoll T, Habermann JK. Possibilities and limitations of 2DE-based analyses for identifying low-abundant tumor markers in human serum and plasma. Proteomics 2016; 16: 2519–2532.

Gérin S, Leprince P, Sluse FE et al. New Features on the Environmental Regulation of Metabolism Revealed by Modeling the Cellular Proteomic Adaptations Induced by Light, Carbon, and Inorganic Nitrogen in Chlamydomonas reinhardtii. Front Plant Sci. 2016;7:1158.

Dekker L, Arsène-Ploetze F, Santini JM. Comparative proteomics of Acidithiobacillus ferrooxidans grown in the presence and absence of uranium. Res Microbiol. 2016;167(3):234-239. doi:10.1016/j.resmic.2016.01.007

Hanneken M, Šlais K, König S. pI-Control in Comparative Fluorescence Gel Electrophoresis (CoFGE) using amphoteric azo dyes. Data Brief. 2015;3:221-228. Published 2015 Apr 1. doi:10.1016/j.dib.2015.03.007

El Rabey HA, Al-Malki AL, Abulnaja KO, Rohde W. Proteome Analysis for Understanding Abiotic Stress (Salinity and Drought) Tolerance in Date Palm (Phoenix dactylifera L.). Int J Genomics. 2015;2015:407165. doi:10.1155/2015/407165

Tesei D, Marzban G, Marchetti-Deschmann M, Tafer  H, Arcalis E, Sterflinger K. Proteome of tolerance fine-tuning in the human pathogen black yeast Exophiala dermatitidis. Journal of Proteomics 128: 39–57.

Kühne H, Schutkowski A, Weinholz S et al. Vitamin D receptor regulates intestinal proteins involved in cell proliferation, migration and stress response. Lipids Health Dis. 2014;13:51. Published 2014 Mar 19. doi:10.1186/1476-511X-13-51

Zadražnik T, Hollung K, Egge-Jacobsen W, Meglič V, Šuštar-Vozlič J: Differential proteomic analysis of drought stress response in leaves of common bean (Phaseolus vulgaris L.). Journal of Proteomics 2013; 78: 254-272.

Hollmann M, Miller I, Hummel K et al. Downregulation of cellular protective factors of rumen epithelium in goats fed high energy diet. PLoS One. 2013;8(12):e81602. Published 2013 Dec 9. doi:10.1371/journal.pone.0081602

Pickering C, Ericson M, Söderpalm B. Chronic phencyclidine increases synapsin-1 and synaptic adaptation proteins in the medial prefrontal cortex. ISRN Psychiatry. 2013;2013:620361.

Labbus K, Henning M, Borkham-Kamphorst E et al. Proteomic profiling in Lipocalin 2 deficient mice under normal and inflammatory conditions. J Proteomics. 2013;78:188-196. doi:10.1016/j.jprot.2012.11.021

Philipp S (2012): Proteomische Analyse der Zellmembran humaner Erythrozyten als Wirtszellen des Malariaerregers Plasmodium falciparum. Dissertation

Mückschel B, Simon O, Klebensberger J et al. Ethylene glycol metabolism by Pseudomonas putida. Appl Environ Microbiol. 2012;78(24):8531-8539. doi:10.1128/AEM.02062-12

Westman JO, Taherzadeh MJ, Franzén CJ. Proteomic Analysis of the Increased Stress Tolerance of Saccharomyces cerevisiae Encapsulated in Liquid Core Alginate-Chitosan Capsules. PLoS ONE 2011; 7(11): e49335.

Fonseca C, Planchon S, Serra T, Chandler S, Saibo N, Renaut J, Oliveira MM, Batista R (2012): Selection of the best comparator for the risk assessment of GM plants - conventional counterparts vs. negative segregant. Poster presentation

Gemoll T, Laubert T, Grimme C, Roblick UJ, Habermann JK. Hochauflösende 2D-Gelelektrophorese von Knochengewebsproben. Biospektrum 2012; 18 (5): 520-521.

May C, Brosseron F, Chartowski P, Meyer HE, Marcus K. Differential proteome analysis using 2D-DIGE. Quantitative methods in Proteomics.  Methods in Molecular Biology 2012; 893 (2): 75-82.

Bjarnadóttir SG, Hollung K, Høy M et al. Changes in protein abundance between tender and tough meat from bovine Longissimus thoracis muscle assessed by iTRAQ and 2-DE analysis. Journal of Animal Science 2012; 90(6): 2035-2043.

Grimme C, Gemoll T, Habermann J, Seide K, Gerlach UJ. Analysis of protein for the diagnosis of osteitis/osteomyelitis: Initial results. Trauma und Berufskrankheit 2012; 14(1): 5-7.

Smalla KH, Wyneken U. Two-Dimensional Gel Electrophoresis-Based Proteomic Analysis of Brain Synapses. Neuroproteomics 2012; 57(3): 95-113.

Barthel A (2010). Protein analysis and tissue culture of the sex pheromone gland of Lepidoptera. Diplomarbeit am Max-Planck-Institut für Chemische Ökologie (Jena).

Weitere Publikationen und Referenzen finden Sie hier.

.

Support

Sehr gerne geben wir Ihnen weitere Auskünfte.

Rufen Sie uns doch an unter 0345 -2799 6413 (Mo - Fr 9.00- 17.00h)

oder schicken Sie uns eine kurze Email an infodyeagnostics.com.

.

Comments are closed.